As we transition from the end of Smart Cities and technology driven agendas into Digital Cities where technology supports policy, I believe it's important to evaluate what we've learned and take a fresh approach moving forward.
In Smart Cities, technology became the agenda with objectives and outcomes being loosely defined, if at all. However, if we simply reverse the concept, we end-up with the notion that technology should support City and government priorities and objectives. Not the other way around.
Thus we enter a new era of Digital Cities where well designed and measured initiatives can yield tangible benefits to governments and their constituents.
At Xaqt, we've adopted a framework where Objectives and Key Results are implemented across each of our Digital City projects.
OKRS (Objectives and Key Results)
In Measure What Matters: How Google, Bono, and the Gates Foundation Rock the World with OKRs , legendary Venture Capitalist John Doerr lays out how the goal-setting system of Objectives and Key Results (OKRs), originally developed at Intel, can help any organization thrive. Applying these same concepts to the Digital Transformation of Government and Cities is like adding magic pixie dust to any initiative.
As Doerr describes, "An OBJECTIVE, is simply WHAT is to be achieved, no more and no less. By definition, objectives are significant, concrete, action oriented, and (ideally) inspirational. When properly designed and deployed, they’re a vaccine against fuzzy thinking—and fuzzy execution."
Whereas, "KEY RESULTS (KRs) benchmark and monitor HOW we get to the objective. Effective KRs are specific and time-bound, aggressive yet realistic. Most of all, they are measurable and verifiable."
So how does this apply to Digital Cities? Spoiler alert, some of those sensors you still have laying around might start to come in handy for measuring policy interventions.
Reducing Traffic Congestion, an Example in OKRS
As an example of OKRs in practice, let's look at an area that has been a hot topic in the Smart Cities arena: Traffic Congestion.
The first step in the new process is for the City or Transit Agency to create a clear objective, which might look something like this:
Improve traffic intersection performance by understanding key metrics like vehicle volumes, wait times, and signal problem detection.
This objective could be measured by these example Key Results:
- Reduce Arrivals on Red by 10% (the percentage of vehicles that arrive at signal when it is red)
- Improve corridor travel time by 15 seconds (choose a key corridor)
- Decrease Split Failures by 15% (green signal time fails to meet the vehicle volume demand)
Notice that a key part of the objective is to understand their existing performance and then to improve on it. Knowing where you're at is a critical starting point in any initiative and one that is often missed. Now it's time to identify the data and (technology) resources required to properly support the OKRs.
In this case, we'll need:
- SPaT (Signal Phase and Time) data from the Traffic Controllers
- Fleet Telematics and Connected Vehicle Data
- Vehicle Detection Sensors in key intersections throughout the corridor
Some of these may already be available to the City. For example many newer traffic signals already support SPaT and advanced logging, and many cities already have telematics devices installed on their fleet vehicles that can be used for various data inputs. Yet, others may need to procure traffic sensors and locate them in strategic locations.
The technology is then put in place to support the policy and operational interventions required to meet the OKRs. Note, as I've previously mentioned, the adoption of new technology is often a challenge; but when its tied to clear and transparent outcomes then your team is more likely to get on board with change.
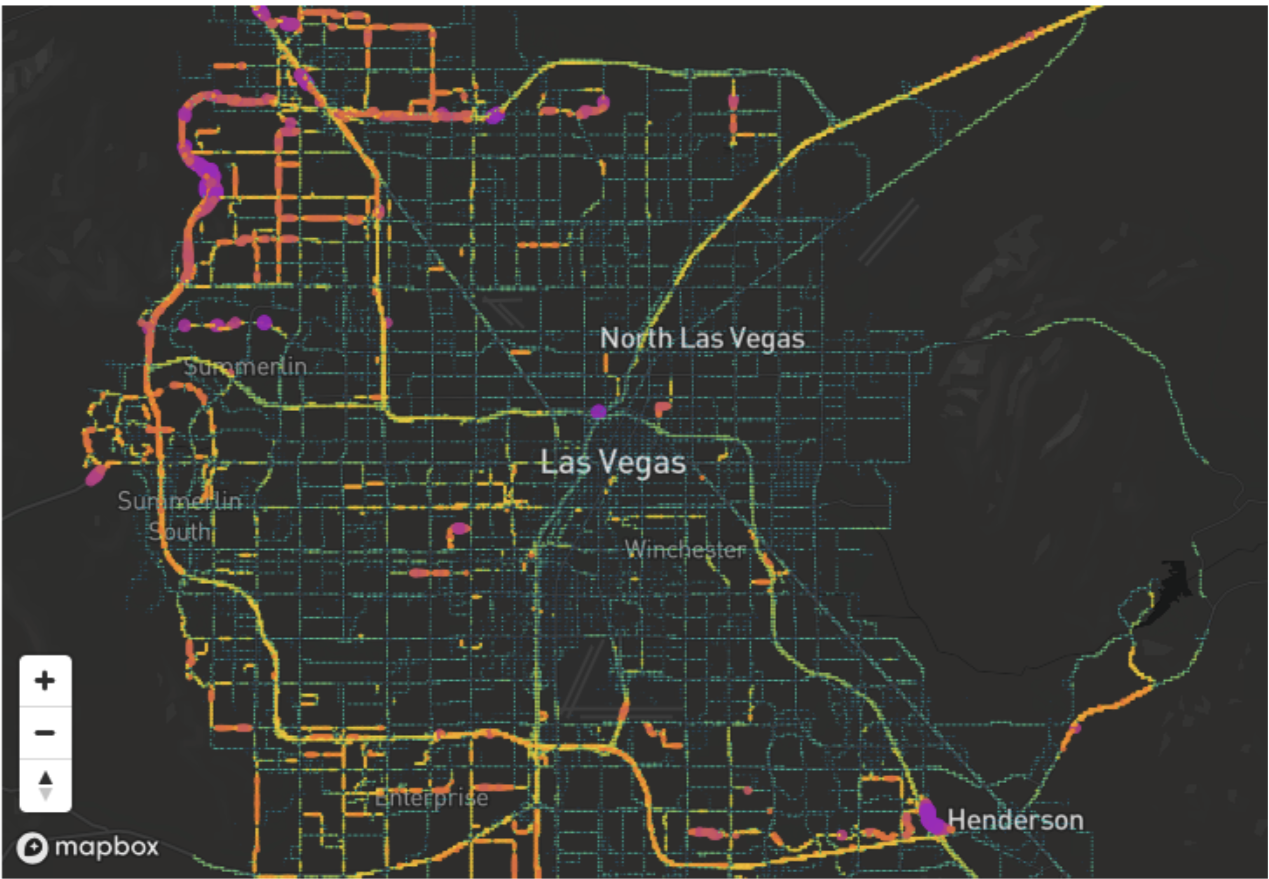
We learned this through our partnership with the Regional Transit Commission of Southern Nevada (RTC), where Xaqt was able to design and implement a system that met and supported a similar set of Objectives and Key Results with them. Through this, VeloCity - Xaqt's platform for Connected Vehicle Analytics was born.
Now What?
Armed with data that maps to specific outcomes, Digital Cities can better advance their strategic goals and themes. We'll unpack this with more real world use cases in the coming weeks.


